Add Title to Chart – Excel & Google Sheets
This tutorial will demonstrate how to add titles to graphs in Excel and Google Sheets.
Adding Titles to Graphs in Excel
Titles are a good way to explaining the graph that you are looking at. It is a good idea to include titles for all of the graphs that you are working with.
Adding a Title
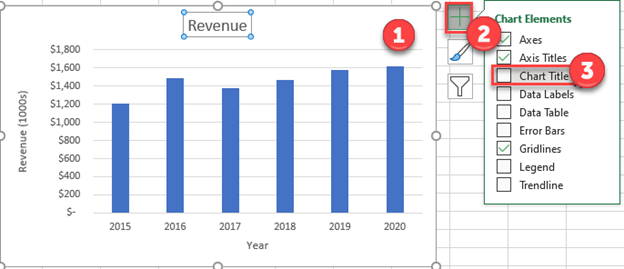
- Click on the Graph
- Click on the + Sign on the top right
- Check Chart Title and a title will show at the top of the graph
Changing Title Name
- Click and highlight the Title
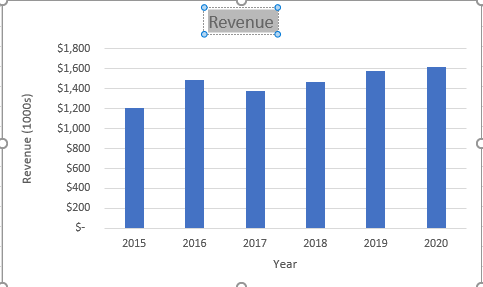
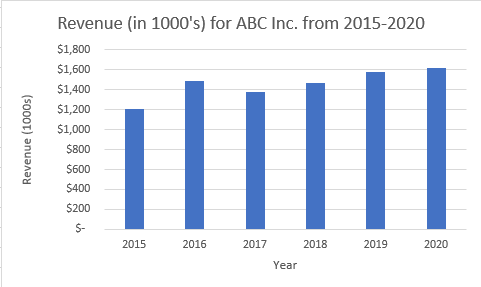
2. Replace the title with a name that gives a clear description of the graph that you are looking at, as seen below.
Create a Dynamic Title Name
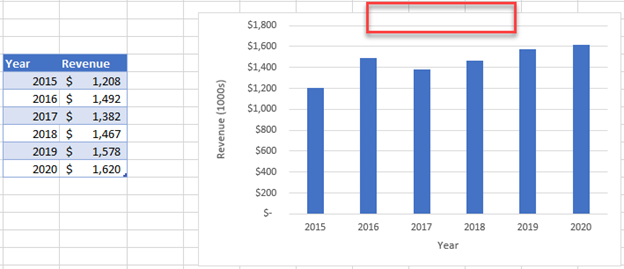
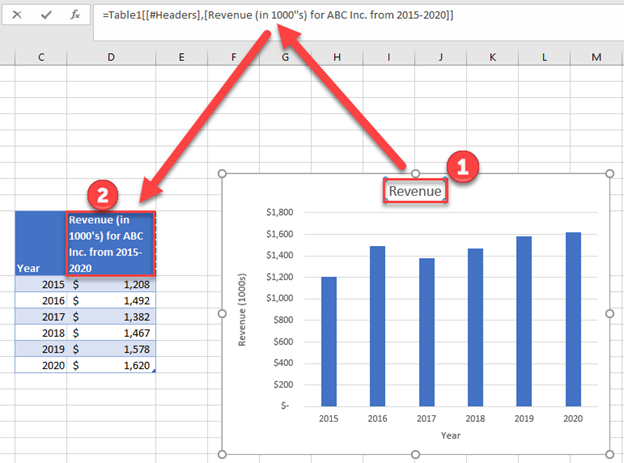
You can also create a dynamic chart title that references a cell value. For example, In this scenario, we want to reference the header of the table.
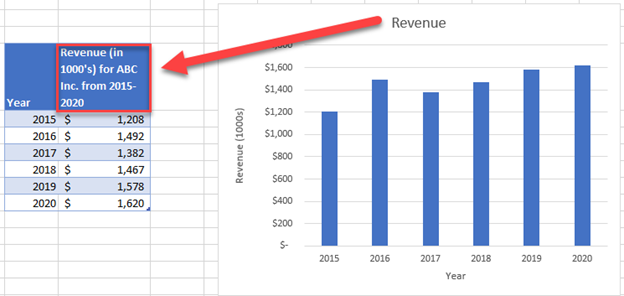
- Click on the Title
- In the formula bar, type = + cell you want to reference
Adding Chart Title in Google Sheets
Similar to Excel, you can add a Chart Title in Google Sheets.
Adding Chart Title
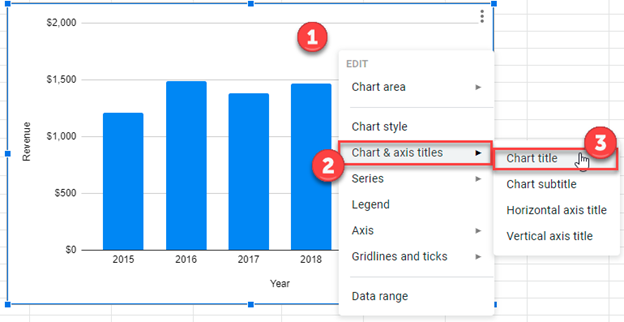
- Right click on the graph
- Select Chart & Axis Titles
- Click Chart Title
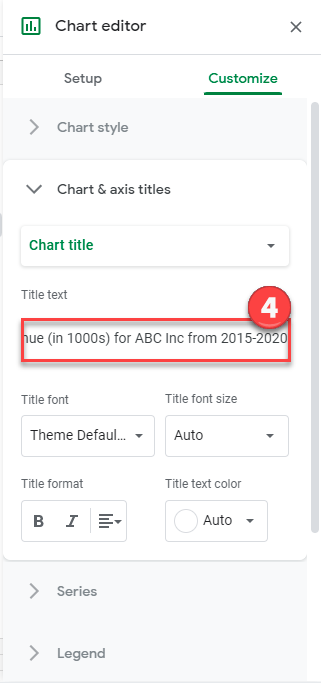
4. Type your New Title for the Chart in the box under Title Text
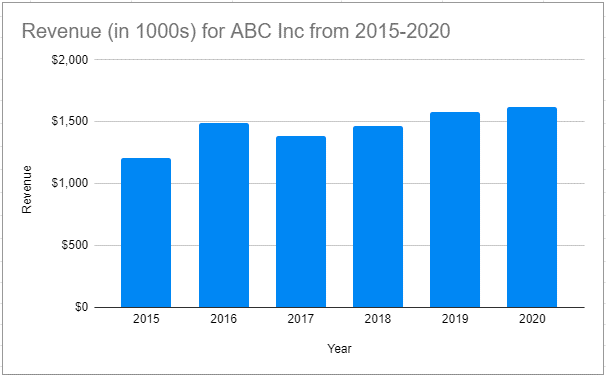
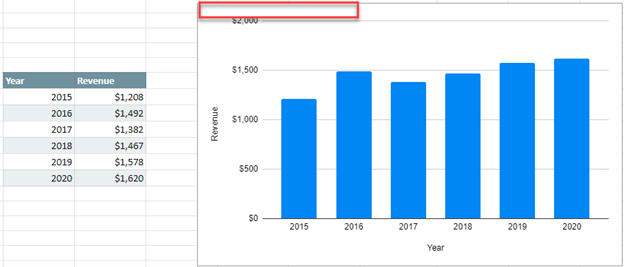
Final Chart with Title
Now the final graph shows a clear understanding of the data that is being shown.